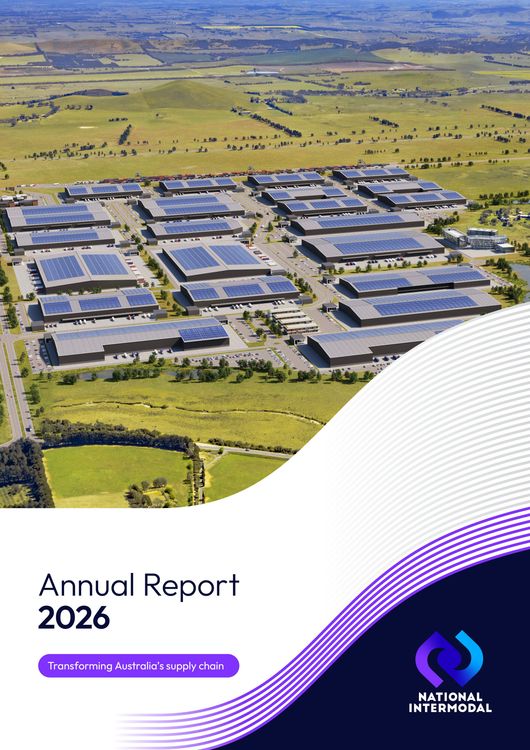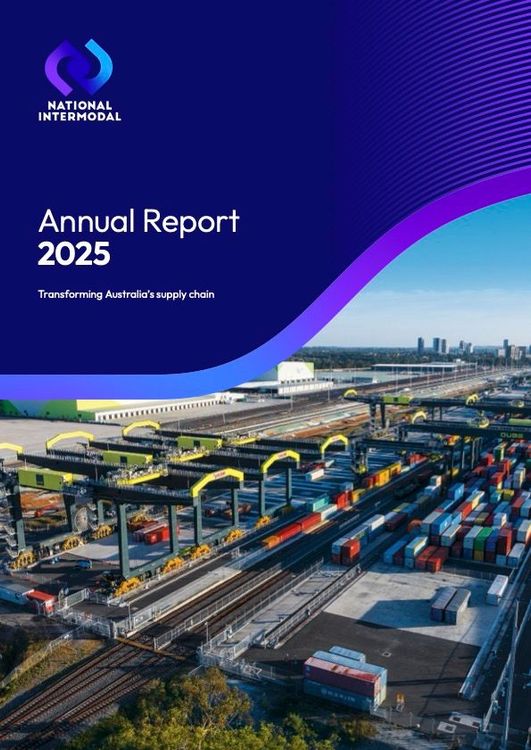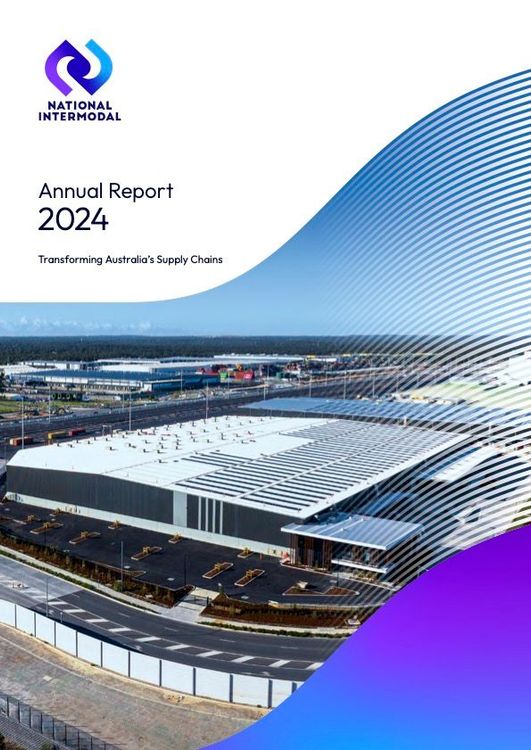

Reports
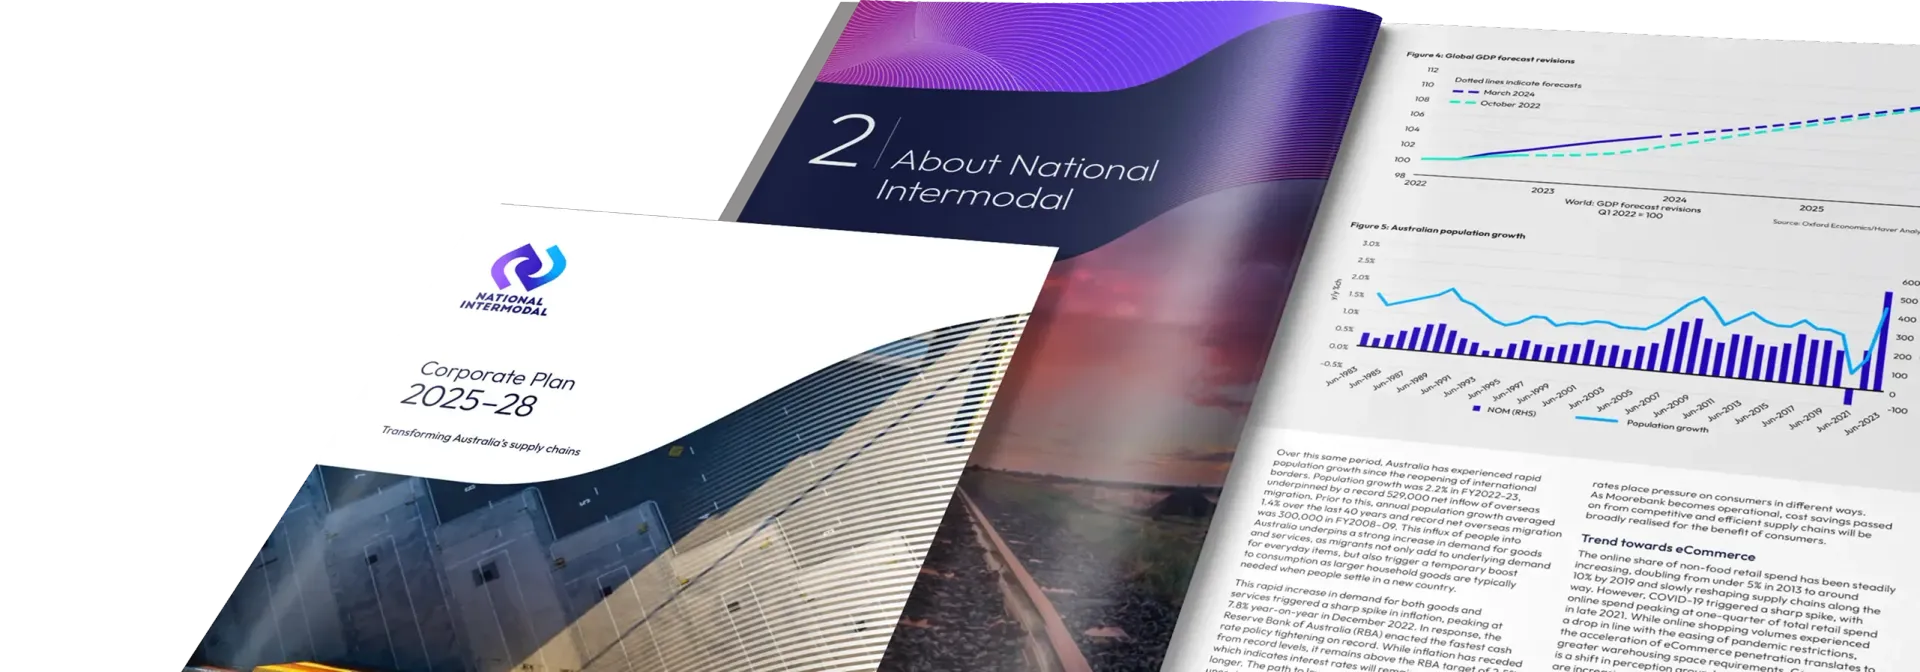
Explore our Annual Reports and corporate publications to learn more about our operations, governance and financial performance.
Our Performance at a Glance
These figures bring to life the scale and impact of our work over the past year. They highlight the progress we have made across our operations, development of intermodal precincts, and delivery against our strategic priorities. Together, they provide a clear snapshot of our performance, growth and the value we are creating for industry, communities and the broader supply chain.
$114m
Net profit after tax
$27m
Share of profit from equity‑accounted investments
$1,225m
Net assets
(12% increase on the prior year)
0
employee and contractor recordable injuries
~150k
truck trips removed from Sydney's roads during FY26
100%
of concrete and steel recycled form the Moorebank Avenue Realignment works